DevOps Use Case: Performing Redis maintenance in Kubernetes
Use Redis-Commander with Webhook Relay ingress controller to access Redis in a Kubernetes cluster
Nowadays it's easy to run pretty much anything in Kubernetes clusters. But what about debugging these services? What if you need to quickly access a service that is normally not exposed to the internet or your intranet and is only accessible from within the cluster? Your service is like:

In this short article, I will demonstrate how to connect to a running Redis instance with an excellent and powerful Redis Commander GUI.
TL;DR
- Deploy Webhook Relay ingress controller
- Deploy Redis Commander
- Access Redis Commander through Webhook Relay tunnel & debug your Redis node
Prerequisites
- Kubernetes, you can either use an existing cluster that you have or use Minikube or Docker for Mac.
- Webhook Relay account, sign up here
- Webhook Relay CLI
Action!
Let's deploy Redis (skip if you already have it running), from the cloned repository deploy it:
kubectl apply -f redis.yaml
It will create:
- Redis deployment
- Service that will make Redis accessible within the cluster
Now, install our tunnel based ingress controller into your cluster:
relay ingress init
This command:
- Creates a namespace
- Create an authentication secret for the ingress controller to use your account
- Deploy an actual ingress controller
You can check whether it's running by:
$ kubectl get pods -n webrelay-ingress
NAME                        READY     STATUS    RESTARTS   AGE
webrelay-69996f8d7c-522z8   1/1       Running   0          10s
Configure Redis Commander
Now, open redis-commander.yaml in your favorite code editor (mine is VSCode :) and edit several details.
If you are on a free tier, unfortunately, you won't be able to choose a subdomain for your tunnel so you will need to create one first. Also, if you have chosen some different name for your Redis service, then update REDIS_HOSTS environment variable.
To create a tunnel, run:
$ relay tunnel create --group webrelay-ingress hello-ingress
2p4ptkh9vutgm8tqavigja.webrelay.io<---->http://127.0.0.1
Now, copy 2p4ptkh9vutgm8tqavigja.webrelay.io into the last, ingress section and to replace [REPLACE THIS WITH YOUR TUNNEL NAME]
apiVersion: v1
kind: Service
metadata:
  labels:
    name: redis-commander
  name: redis-commander
spec:
  ports:
  - port: 8081
    protocol: TCP
    targetPort: 8081
  selector:
    app: redis-commander
  type: NodePort
---
apiVersion: apps/v1
kind: Deployment
metadata:
  name: redis-commander
spec:
  replicas: 1
  selector:
    matchLabels:
      app: redis-commander
  template:
    metadata:
      labels:
        app: redis-commander
        tier: backend
    spec:
      containers:
      - name: redis-commander
        image: rediscommander/redis-commander:latest
        env:
        - name: REDIS_HOSTS
          value: redis:redis:6379
        - name: REDIS_PORT
          value: ""
        ports:
        - name: redis-commander
          containerPort: 8081
---
apiVersion: extensions/v1beta1
kind: Ingress
metadata:
  annotations:
    kubernetes.io/ingress.class: webrelay # other ingress classes will be ignored
  name: relay-ingress
spec:
  rules:
    - host: [REPLACE THIS WITH YOUR TUNNEL NAME]
      http:
        paths:
        - path: /
          backend:
            serviceName: redis-commander
            servicePort: 8081
Once you have finished editing, create it:
kubectl apply -f redis-commander.yaml
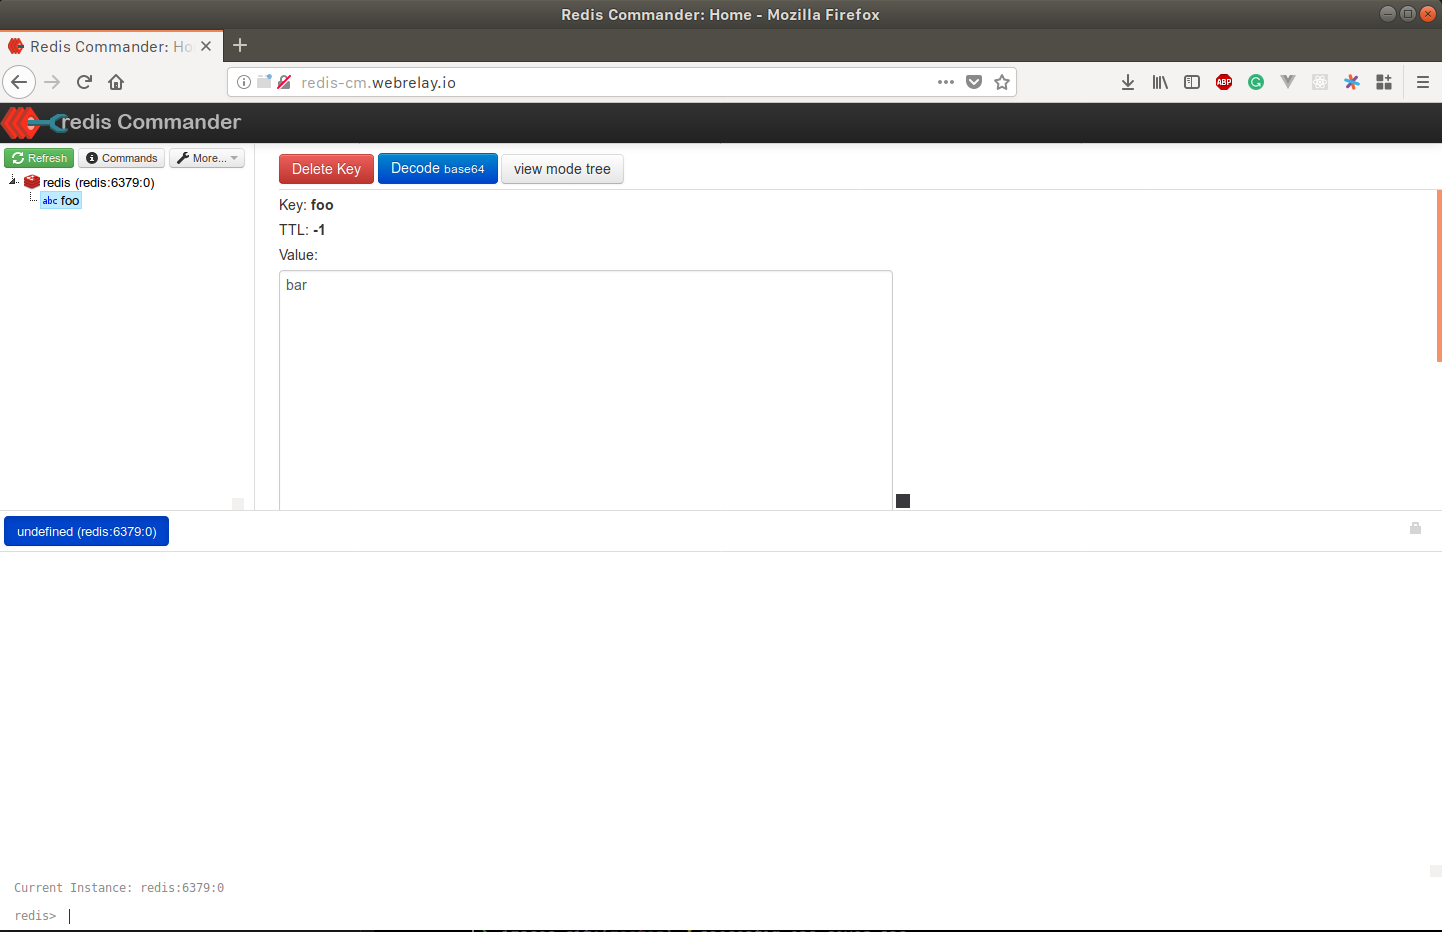
It should now be accessible from your browser:

Cool, yeah? Good luck with your other experiments!

./wrap_up
To wrap up, the same strategy can be applied to other services like Prometheus or Grafana. You can create tunnels only when you need them, for example, while Grafana can always be connected, you would only want to have a look at Prometheus when you are not sure if service discovery is missing something or want to use raw queries.

