

Webhook Logs & Delivery Monitoring
See every webhook delivery, latency and failure in one place. Webhook Relay logs each event with its status and response, and lets you retry any delivery.
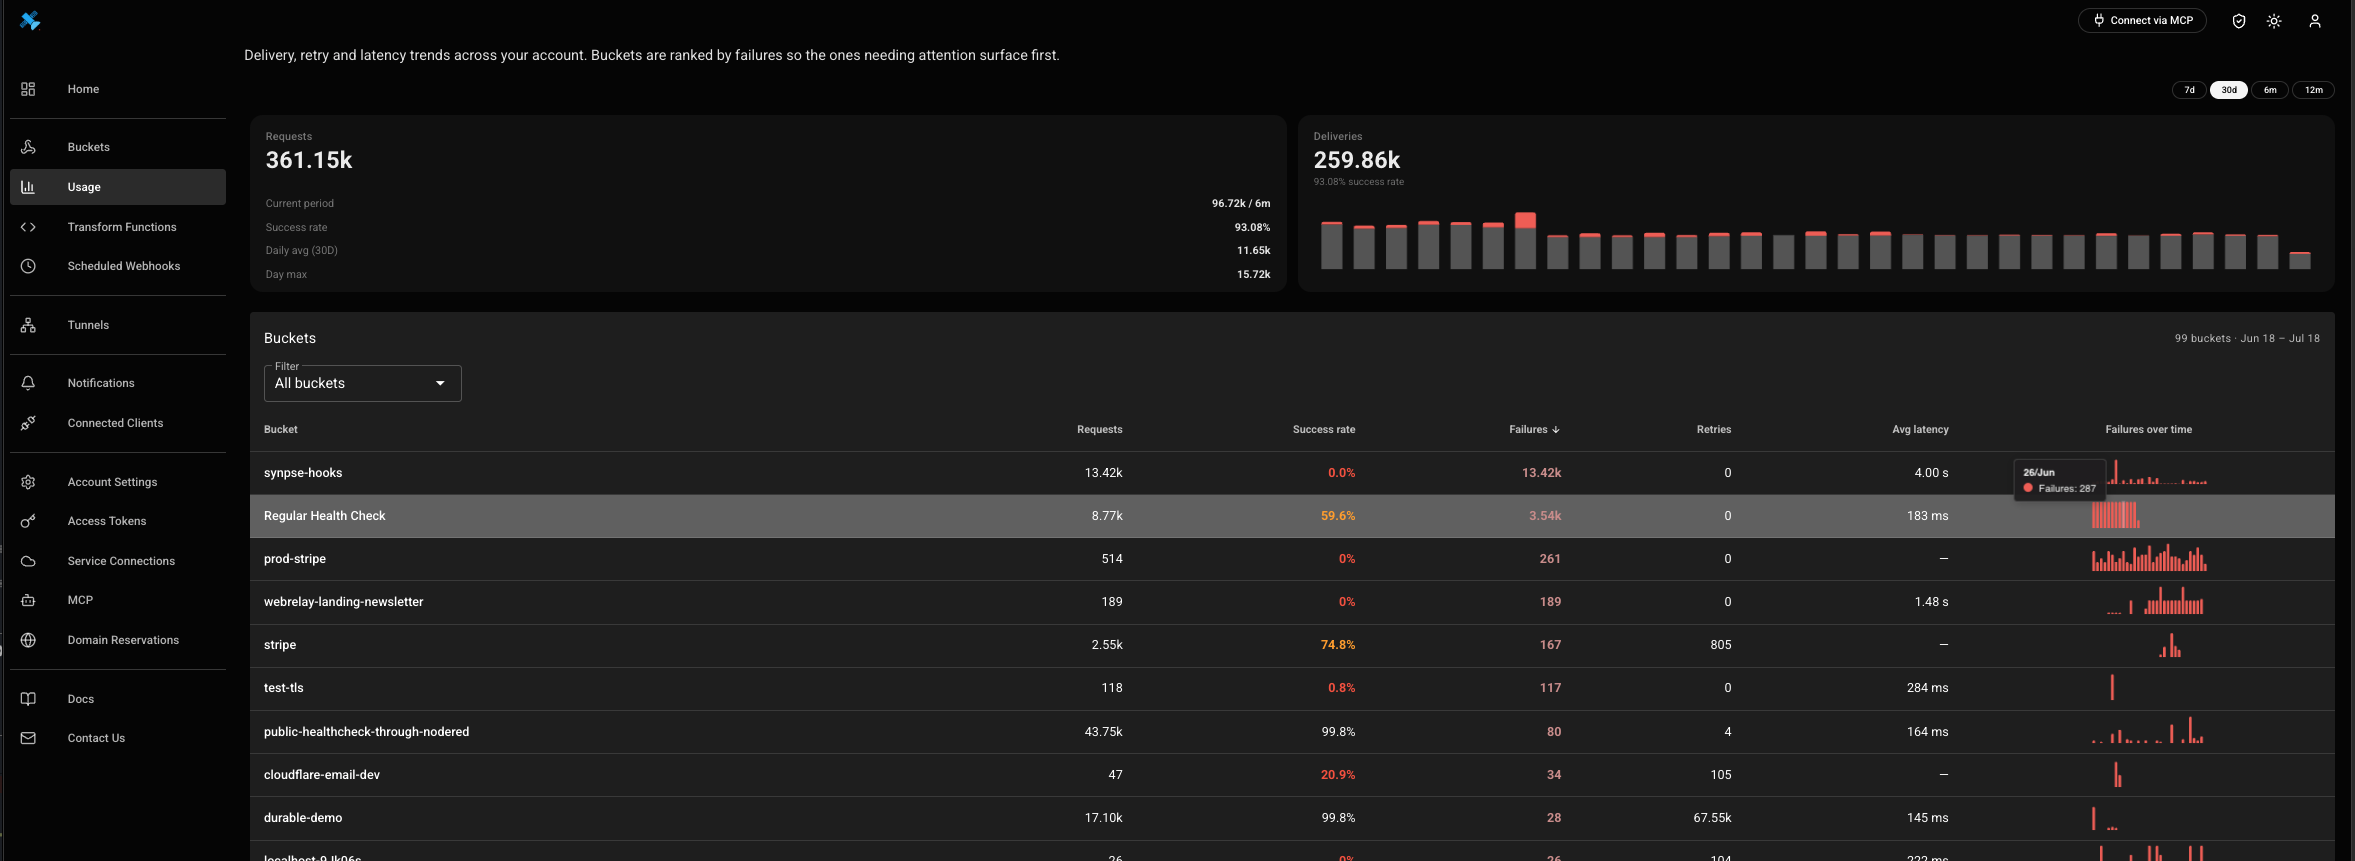
You can't fix what you can't see. Most webhook setups are a black box: an event either lands or it doesn't, and when something breaks you're left grepping application logs hoping the payload was written down somewhere. Webhook Relay records every delivery — request, response, status, latency and retry history — so the answer to "did that webhook arrive, and if not, why?" is always one click away.
The problem: webhooks fail silently
A webhook that never arrives leaves no trace on your side. The sender thinks it delivered, your service never saw it, and nobody notices until a customer asks where their order confirmation went. Even when you do log incoming requests, you're missing half the story — the response your endpoint returned, how long it took, how many times it was retried, and whether the failure was a one-off blip or a bucket that's been failing all week.
Building that visibility yourself means shipping structured logs, a metrics pipeline, dashboards and alerting — a project in its own right, just to answer basic questions about your own traffic.
The solution: every delivery, logged and searchable
Webhook Relay captures every request the moment it arrives and every delivery attempt that follows. Nothing is a black box:
- What was sent — method, path, headers and full body.
- What came back — your endpoint's status code, response headers and body.
- How it went — delivered, retrying or failed, with latency and the number of attempts.
Account-wide delivery health
The Usage view rolls every bucket up into one picture: total requests, deliveries, overall success rate, and a per-bucket breakdown of requests, success rate, failures, retries and average latency. Buckets are ranked by failures, so the ones that need attention surface at the top — and a failures-over-time sparkline shows whether a problem is new or ongoing. Switch the window between 7 days, 30 days, 6 months and 12 months.
Per-bucket monitoring
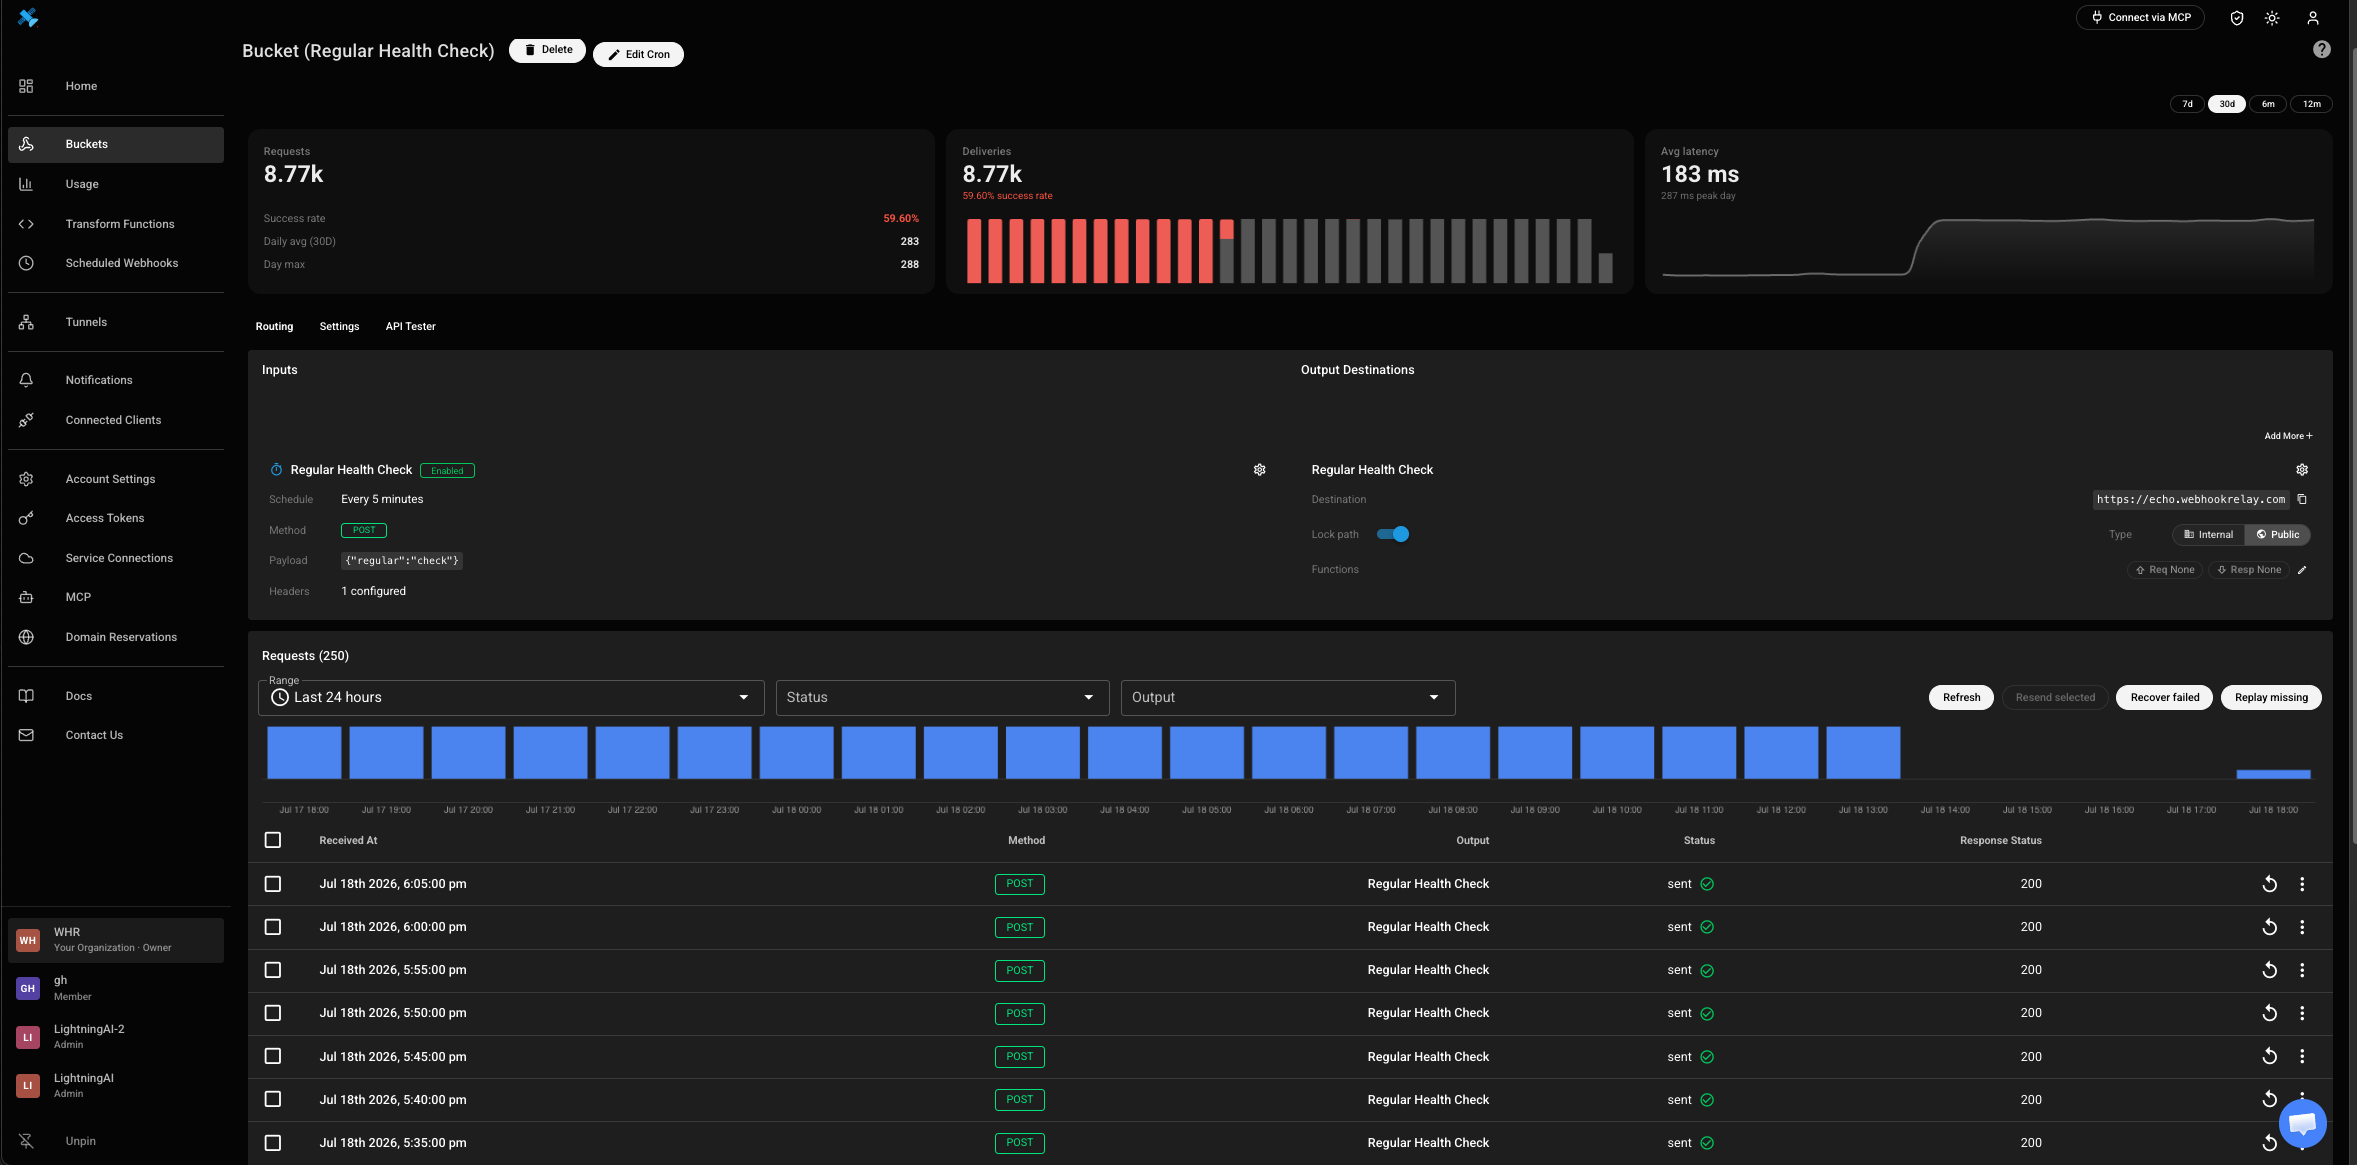
Open any bucket to see its delivery rate, average latency (including the peak day) and a live log of every request. Filter by time range, delivery status or output destination to zero in on exactly the deliveries you care about — for example, every failed delivery to your production endpoint in the last 24 hours.
Inspect any delivery
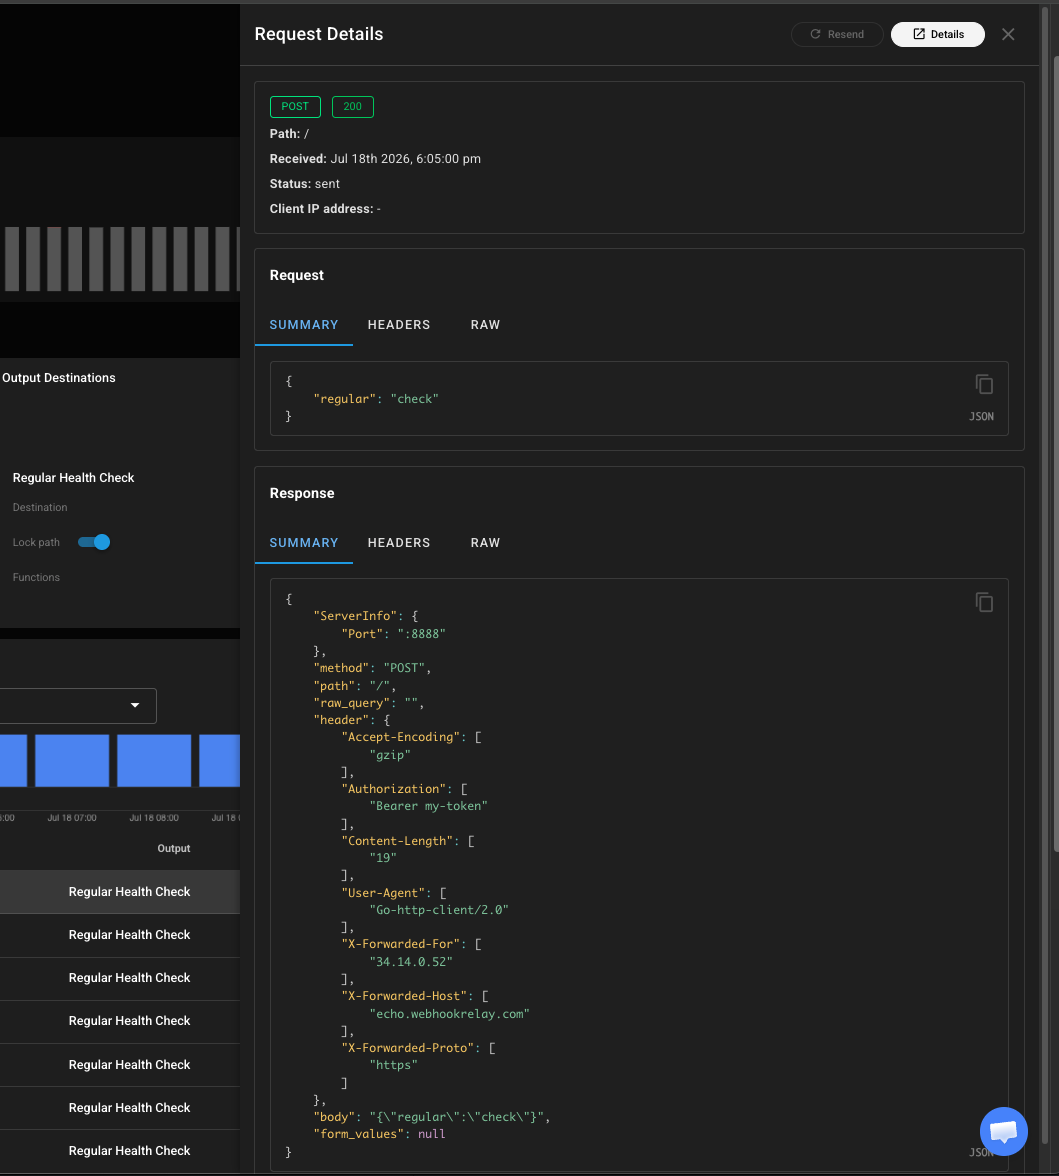
Click any request to see the complete picture: the exact payload that came in, every header, and the full response your endpoint returned. It's the fastest way to debug a signature mismatch, a malformed body or an endpoint that's quietly returning a 500 — no need to reproduce anything or add logging to your own service.
Retry, recover and replay
Observability isn't just for looking — it's for fixing. From the log you can resend any delivery, recover failed deliveries in bulk after an endpoint recovers, or replay missing events to backfill a destination that was down. Combined with durable retries, a delivery that failed while your service was deploying is already being retried automatically — and if you ever need to force one through by hand, it's one click.
Where it earns its keep
- Debugging integrations. See the raw payload a provider actually sent, and the exact response you returned, without touching your own code.
- Catching silent failures. A bucket dropping from 99% to 60% success rate is obvious at a glance, long before a customer complains. Prefer a push? Wire alerts so incidents open when deliveries fail.
- Incident recovery. After an outage, recover and replay everything that failed instead of reconciling by hand.
- Capacity and latency. Watch average and peak latency per bucket to spot a slow endpoint before it becomes a backlog.
Part of a complete webhook gateway
Delivery logs are the observability layer of Webhook Relay's webhook gateway — the same platform that gives you durable retries, throttling, fan-out to multiple destinations and delivery to internal services. For a tamper-evident record of configuration changes — who edited a bucket, output or forwarding rule — see audit logs.
Ready to stop guessing whether your webhooks arrived? Create a free account and watch your first delivery land in real time.